OgulcanUI
Ogulcan Studio UI component pack
README
OgulcanUI
Fastest-first, zero-dependency chart Web Components for enterprise dashboards.

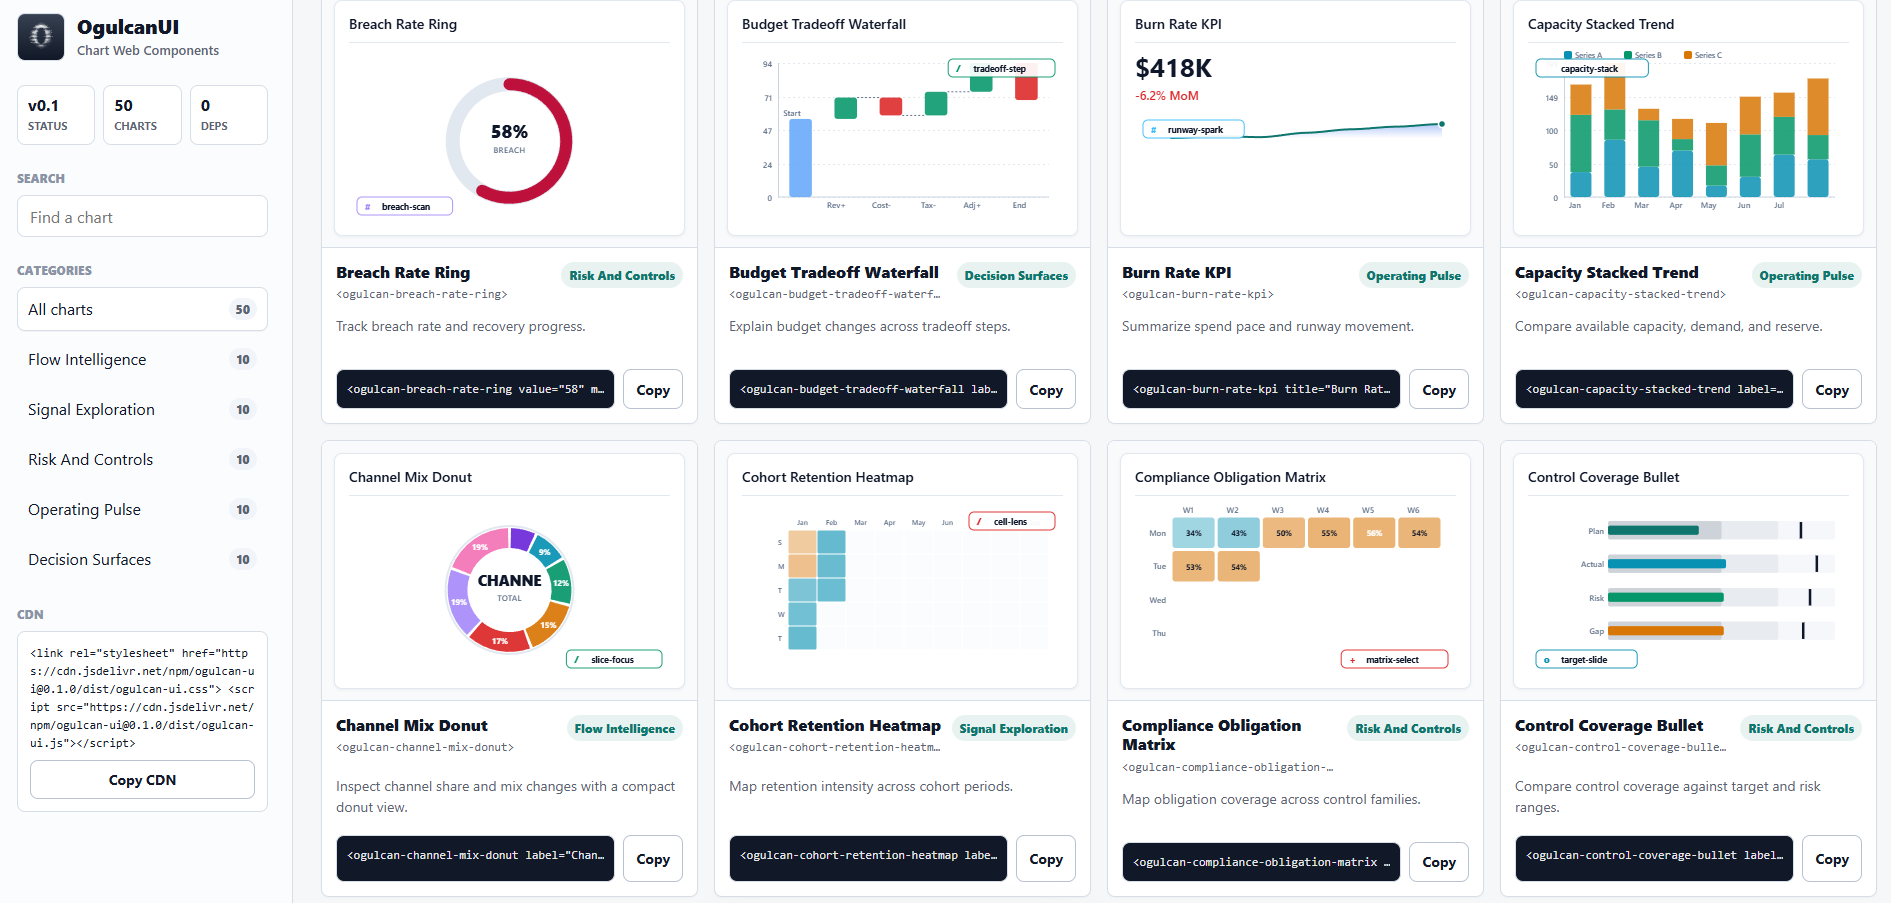
OgulcanUI v0.1.0 ships 50 vanilla Web Component charts in one browser file. It is built for teams that need dashboard charts to mount quickly, update quickly, stay small, and work without React, Svelte, Vue, Chart.js, D3, hydration, build tooling, or runtime dependencies.
The Speed Story
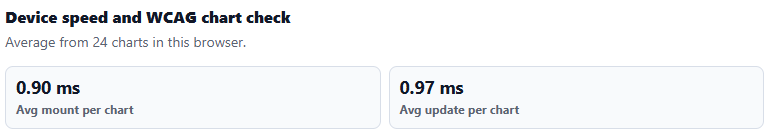
OgulcanUI is designed around the part users feel first: how fast charts appear and update on real devices. The demo includes a browser-side speed panel so every team can measure mount and update time on the exact laptop, phone, browser, kiosk, or embedded environment they care about.
| Speed signal | Current proof |
|---|---|
| Average mount | Screenshot run: 0.90 ms per chart |
| Average update | Screenshot run: 0.97 ms per chart |
| Load gate | bun run verify:load passes all 50 charts |
| Runtime model | One JS file, static SVG, Shadow DOM, no framework runtime |
| Update model | Redraw fingerprinting skips unchanged charts |
| Data safety | Capped parsing, capped series length, oversized attributes rejected or downsampled |
The screenshot is from one local browser run and will vary by device. That is intentional: OgulcanUI exposes the benchmark in the demo so users can verify speed in their own environment instead of trusting a synthetic marketing number.
Why Teams Choose OgulcanUI
| Requirement | OgulcanUI v0.1.0 |
|---|---|
| Fast dashboards | Browser-native custom elements with no virtual DOM or external chart engine |
| Simple delivery | One CDN script or one hosted repository artifact |
| Small transfer | ogulcan/ogulcan.js: 668.7 KB raw, 35.3 KB gzip |
| Tiny CSS | ogulcan/ogulcan.css: 12.1 KB raw, 3.2 KB gzip |
| Chart coverage | 50 ready-made charts across operations, risk, finance, product, and strategy |
| Accessibility checks | 50/50 charts pass automated chart text-alternative checks |
| Framework fit | Plain HTML, React, Svelte, Vue, Astro, Rails, Laravel, Django |
| License | MIT |
OgulcanUI is not a code-copy starter kit. It is a chart runtime you consume as a browser file.
Quick Start: npm
Install the package from npm:
npm install ogulcan-ui
Quick Start: CDN
<link rel="stylesheet" href="https://cdn.jsdelivr.net/npm/[email protected]/dist/ogulcan-ui.css">
<script src="https://cdn.jsdelivr.net/npm/[email protected]/dist/ogulcan-ui.js"></script>

<ogulcan-market-pulse-line
  label="Market pulse"
  color="#2563eb"
  data="42,48,46,58,63,70,76">
</ogulcan-market-pulse-line>
Quick Start: Repository File
Download these files from this repository and serve them from your site:
ogulcan/ogulcan.js
ogulcan/ogulcan.css
Then use them like this:
<link rel="stylesheet" href="/assets/ogulcan.css">
<script src="/assets/ogulcan.js"></script>

<ogulcan-risk-appetite-gauge
  label="Risk appetite"
  value="68"
  min="0"
  max="100"
  color="#b45309">
</ogulcan-risk-appetite-gauge>
ogulcan.js contains all 50 charts. You do not need to copy src/components/*, scripts/*, or generator files into your product.
Performance Architecture
OgulcanUI stays fast by keeping the runtime boring in the best possible way:
- No framework runtime
- No virtual DOM
- No external chart engine
- No fetch after the file loads
- No canvas dependency
- Static SVG rendered inside Shadow DOM
- Data parsing capped at 128 points per series
- Oversized attributes rejected or downsampled
- Redraw skipped when the chart fingerprint is unchanged
- ResizeObserver updates batched with
requestAnimationFrame
Current verified load result:
bun run verify:load
Passed: 50
Failed: 0
Accessibility
Every chart exposes a lightweight screen-reader summary:
- The chart host uses
role="img". - Decorative SVG drawing is hidden from assistive technology.
- A hidden
.chart-a11y-summarytext alternative is generated per chart. - Automated browser audits cover all 50 charts.
Current verified accessibility result:
bun run verify:a11y
Passed: 50
Failed: 0
This is automated WCAG-oriented coverage for chart text alternatives and component semantics. Product teams still need to test complete pages for their own color contrast, headings, navigation, keyboard flows, and content.
Use With React, Svelte, Or Plain HTML
OgulcanUI charts are custom elements. Framework wrappers are optional.
Plain HTML:
<ogulcan-uptime-kpi-spark
  title="Uptime"
  value="99.98%"
  change="+0.03%"
  trend="up"
  sparkline="97,98,98,99,100"
  color="#0f766e">
</ogulcan-uptime-kpi-spark>
React:
export function DashboardChart() {
  return (
    <ogulcan-market-pulse-line
      label="Market pulse"
      color="#2563eb"
      data="42,48,46,58,63,70,76"
    />
  );
}
Svelte:
<ogulcan-market-pulse-line
  label="Market pulse"
  color="#2563eb"
  data="42,48,46,58,63,70,76" />
Chart API
Most charts:
<ogulcan-revenue-stream-treemap
  label="Revenue"
  color="#0f766e"
  data="32,24,18,14,12">
</ogulcan-revenue-stream-treemap>
Gauge and ring charts:
<ogulcan-threshold-ring
  label="Threshold"
  value="74"
  min="0"
  max="100"
  color="#be123c">
</ogulcan-threshold-ring>
KPI spark charts:
<ogulcan-burn-rate-kpi
  title="Burn rate"
  value="$418K"
  change="-6.2% MoM"
  trend="down"
  sparkline="72,74,73,78,82,85,88"
  color="#1d4ed8">
</ogulcan-burn-rate-kpi>
Data can be a comma-separated numeric list or a JSON array. For runtime changes, update attributes:
const chart = document.querySelector("ogulcan-market-pulse-line");
chart.setAttribute("data", "45,49,53,61,66,72");
Chart Catalog
| Category | Charts |
|---|---|
| Flow Intelligence | CustomerJourneySankey, RevenueStreamTreemap, ChannelMixDonut, ConversionPathFunnel, SupplyChainGantt, DependencyRadar, AllocationWaterfall, SegmentBridgePareto, ProductAdoptionStack, WorkflowStepArea |
| Signal Exploration | DemandForecastProjection, AnomalyBandControl, CohortRetentionHeatmap, MarketPulseLine, SensorDriftScatter, QualityHistogram, ScenarioSensitivityMultiLine, VolatilityBoxplot, GrowthCurveArea, ThresholdRing |
| Risk And Controls | ComplianceObligationMatrix, IncidentSeverityPareto, AccessPostureRadar, RiskAppetiteGauge, AuditFindingWaterfall, ControlCoverageBullet, FraudPatternScatter, PolicyExceptionHeatmap, ExposureLimitBars, BreachRateRing |
| Operating Pulse | UptimeKpiSpark, QueueDepthBars, LatencyControlChart, CapacityStackedTrend, ReleaseTrainGantt, ServiceHealthMatrix, ErrorBudgetLine, ThroughputHistogram, WorkforceUtilizationHBars, BurnRateKpi |
| Decision Surfaces | PriceElasticityScatter, PortfolioOptimizationRadar, BudgetTradeoffWaterfall, PrioritizationTreemap, StrategyFunnel, ForecastConfidenceBoxplot, OpportunityPareto, InvestmentMixDonut, PlanVsActualBullet, ScenarioOutcomeProjection |
Tag names are ogulcan- plus the kebab-case chart name. Example: MarketPulseLine becomes <ogulcan-market-pulse-line>.
Local Demo
bun install
bun run build
bun run start
Open:
http://localhost:3000/demo.html
The demo is a searchable live chart catalog with copyable snippets and a browser-side speed/WCAG panel.
Development
Install:
bun install
Build all distributable files:
bun run build
Run core verification:
bun run verify:a11y
bun run verify:load
bun run test:playwright:structural
Important source locations:
| Path | Purpose |
|---|---|
ogulcan/ogulcan.js |
Downloadable all-chart browser file for users |
ogulcan/ogulcan.css |
Optional shared CSS tokens for users |
dist/ogulcan-ui.js |
npm/CDN browser bundle |
src/components/ |
Generated component source, not the recommended app integration path |
scripts/lib/banking-chart-catalog.js |
Catalog metadata and attribute specs |
scripts/generate-unique-charts.js |
Regenerates the 50 chart components |
docs/DOCUMENTATION.md |
Full documentation |
Editing Or Extending
For normal websites and products, do not edit internals. Use ogulcan.js or the CDN.
For contributors:
- Edit catalog metadata in
scripts/lib/banking-chart-catalog.js. - Edit shared chart generation in
scripts/generate-unique-charts.js. - Run
bun run generate-charts. - Run
bun run build. - Run accessibility and load verification.
The 50 chart folders are generated output. Direct manual edits inside one chart folder can be overwritten by the generator.
License
MIT - see LICENSE.